How to Measure Affiliate Program Performance (The Metrics That Actually Matter)

Most affiliate programs track clicks and total revenue. That is not enough. If you want to scale an affiliate channel profitably, you need to understand activation rates, funnel drop-offs, partner quality, commission sustainability, and payout health. Without that visibility, growth eventually stalls. You recruit more partners, but revenue does not increase. You see more clicks, but conversions flatten. You pay more rewards, but profit margins shrink.
Affiliate program analytics should help you answer one core question: Is this channel growing profitably, and why?
This guide breaks affiliate program analytics into five essential layers. Together, they form a complete system for measuring performance, identifying bottlenecks, and optimizing for sustainable growth.
The problem with surface-level metrics
Clicks and total revenue are lagging indicators. They tell you what already happened, not why it happened or whether it is sustainable.
Here are common scenarios:
Clicks double, but revenue stays flat.
Revenue increases, but net profit declines.
Your partner count grows, but only a handful drive sales.
Commissions rise faster than revenue.
Payout requests pile up, and partners become disengaged.
Without deeper visibility, these issues appear disconnected. With proper analytics, they form a clear pattern. Affiliate performance is not one metric; it is a system.
Let’s break it down.
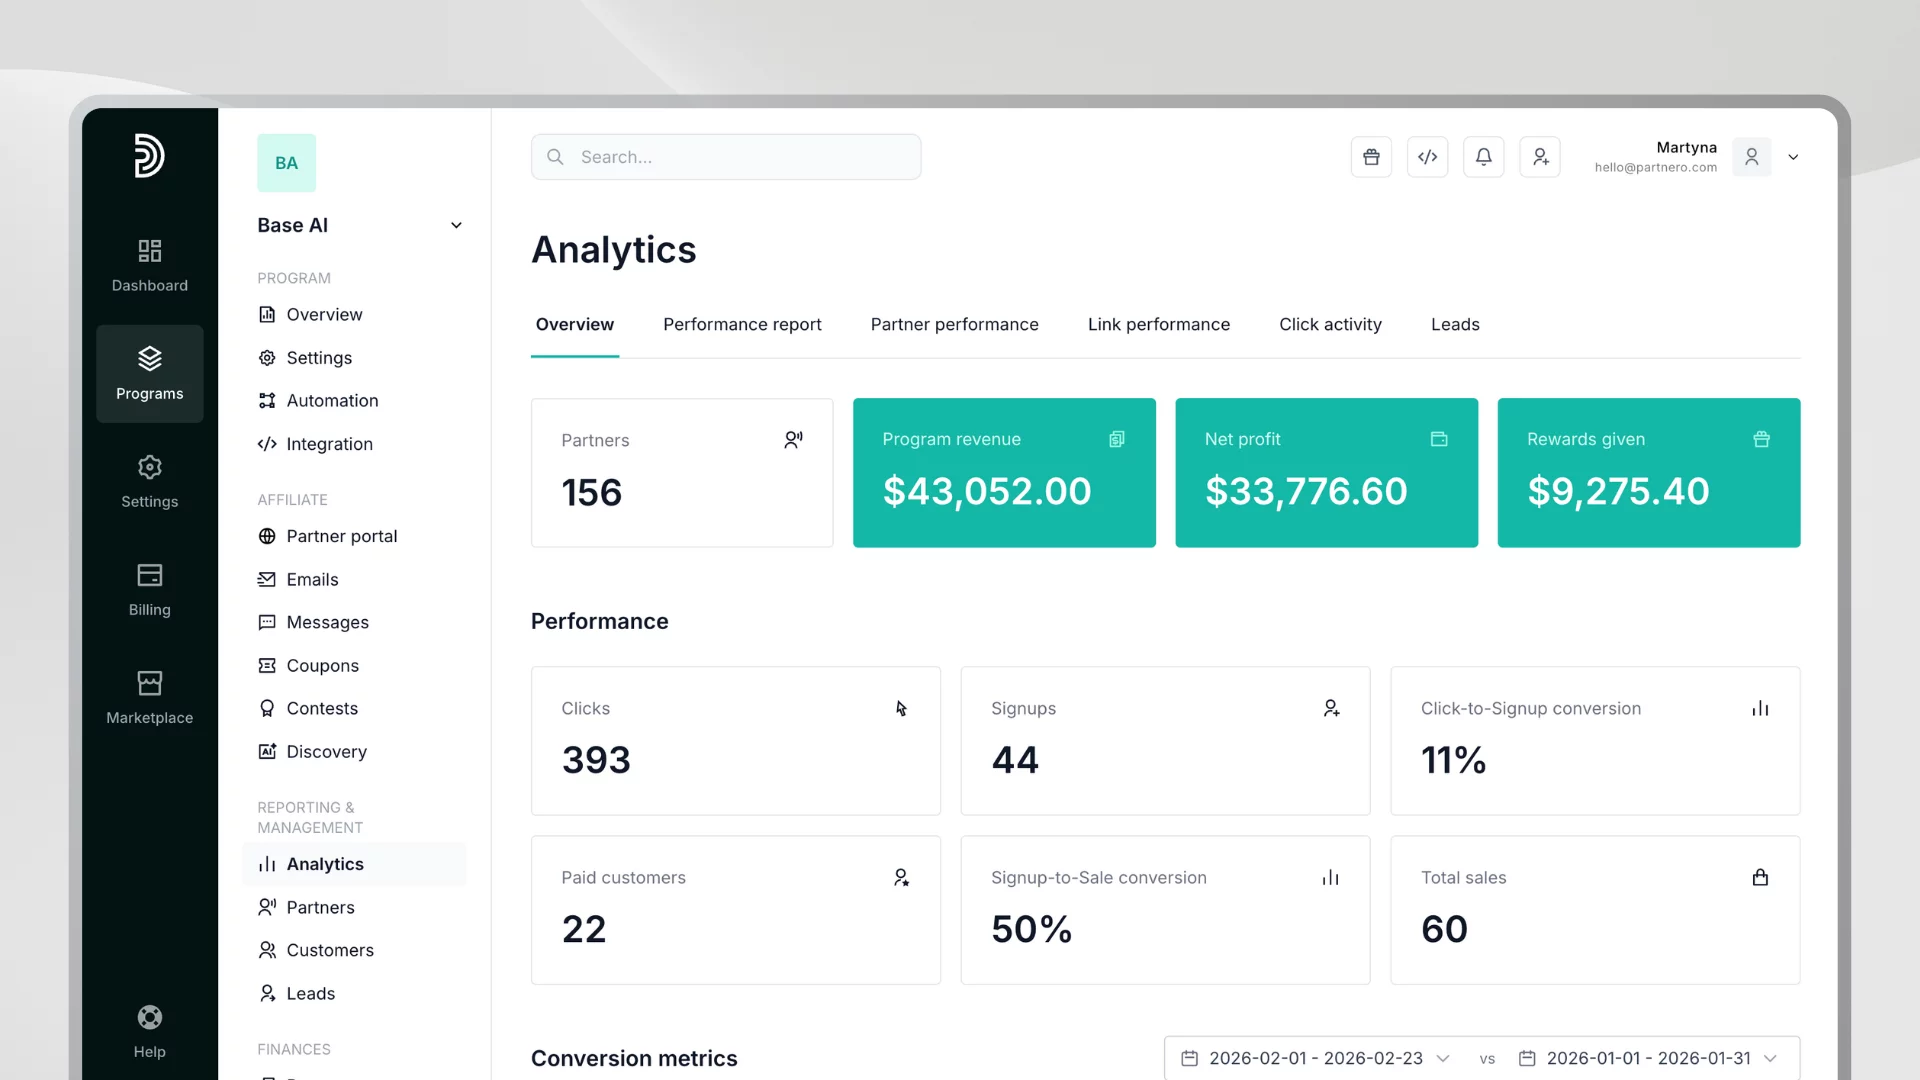
Layer 1: Program health
→ This is your affiliate command center. See the overall size, activity, revenue, conversions, and payout health of your program at a glance.
Before analyzing trends or cohorts, you need a real-time understanding of your program’s overall condition. Think of this as your executive dashboard. At this level, you should always know:
1. The size and activity of your network
Total approved partners
Total signups generated
Total paid customers
Total purchases
A large partner count means little if most affiliates are inactive. The percentage of partners generating signups and paid customers is a far more meaningful signal than raw network size.
2. Revenue vs ent profit
Revenue alone can be misleading. If your affiliate channel generates $100,000, but $45,000 goes back to commissions, your margin structure may not be sustainable.
Tracking net profit after rewards ensures you are scaling intelligently, not just aggressively.
3. Funnel conversion rates
Two core metrics define your affiliate funnel:
Click-to-signup conversion
Signup-to-sale conversion
These reveal exactly where prospects drop off: if click-to-signup falls, your landing page or traffic quality may be the issue. If signup-to-sale declines, your onboarding or pricing may need refinement.
Without both metrics, you are guessing.
4. Reward liability and cash flow
Commissions are not just performance metrics; they are financial obligations. You should have clear visibility into:
Rewards given
Rewards unclaimed
Rewards in review
Rewards already paid
This allows you to forecast payout exposure and avoid cash flow surprises.
5. Payout pipeline health
Delayed or complicated payouts create friction. Friction reduces partner motivation. Reduced motivation slows growth. Monitoring payout requests, eligible partners, and average payout size helps prevent retention problems before they appear.
This first layer answers one question: Is the affiliate program fundamentally healthy?
A proper analytics overview should provide this clarity instantly, without requiring filters or configuration.
Layer 2: Traffic and funnel performance
→ Turning activity into revenue. Analyze clicks, signups, sales, average order value, and conversion rates to understand how well affiliate traffic converts.
Once you understand overall program health, the next step is to examine traffic trends and conversion performance. While revenue is a lagging indicator, funnel metrics give early signals of success or trouble. At this level, you analyze:
Click volume
Signup volume
Paying customers
Total sales
Generated revenue
Net profit
Average order value
1. Traffic volume vs traffic quality
More clicks do not automatically mean better performance. If click volume increases but click-to-signup conversion drops, partners may be sending lower-intent traffic. If signups increase but signup-to-sale conversion declines, the audience may not align with your product.
Conversion rates are diagnostic tools. They tell you whether your positioning, landing pages, and onboarding flow are aligned with the traffic affiliates generate.
2. Average order value and revenue quality
Not all revenue is equal. If one partner drives 50 small transactions and another drives 10 high-value purchases, the second partner may be more strategically important.
Tracking average order value helps you evaluate revenue quality, not just quantity.
3. Time-based grouping for trend analysis
Daily grouping helps you spot anomalies in performance, while weekly grouping smooths out short-term fluctuations. Monthly grouping, on the other hand, reveals longer-term trends and patterns. A mature affiliate analytics system should allow you to switch between these views easily, so you can analyze performance at the right level of detail for any situation.
4. Cohort-based revenue attribution
Blended revenue can distort reality. For example, March revenue may come from customers acquired in January, February, and March. Isolating revenue generated by each period’s new signups reveals the true acquisition value of that cohort. This prevents inflated interpretations and gives you a clearer view of partner-driven customer lifetime value.
This layer answers: Is affiliate traffic improving, and is it converting profitably over time?
Layer 3: Partner activation and quality
→ Where most programs plateau. Measure partner activation, revenue per partner, median days to first sale, and cohort performance to ensure your affiliates are productive and profitable.
Recruiting affiliates is often straightforward, but keeping them motivated takes more effort. In most programs, a small percentage of partners drive the majority of revenue, following an 80/20 pattern. The challenge is determining whether this imbalance is a natural outcome or a sign of deeper structural issues in onboarding or partner management.
1. Activation metrics that matter
Instead of asking “How many partners do we have?” ask:
What percentage of partners have generated at least one signup?
What percentage has generated at least one paying customer?
How long does it take new partners to generate their first sale?
Median days to first sale is particularly powerful. It predicts long-term engagement. If new partners take too long to close their first deal, they are more likely to churn.
2. Revenue per partner
Total revenue can hide weak partner productivity. Average revenue per partner reveals whether your recruitment quality is improving or declining. If revenue grows but average revenue per partner falls, you may be adding low-performing affiliates faster than high-performing ones.
3. Commission sustainability
Tracking the reward percentage of revenue ensures your commission structure supports long-term growth. If commissions consistently consume an increasing share of revenue, your program may scale in volume but not in profitability.
4. Cohort analysis by sign-up month
Grouping partners by their sign-up month reveals patterns:
Are newer cohorts ramping up faster?
Is onboarding improving activation speed?
Are certain recruitment campaigns producing higher-quality affiliates?
Cohort analysis transforms affiliate management from reactive monitoring into strategic optimization.
5. Segmentation by partner type
Tag-based segmentation allows comparison between:
Influencers
Content creators
Paid media partners
Premium affiliates
Understanding which segments drive higher revenue per partner and faster activation enables you to refine your recruitment strategy.
This layer answers: Are we recruiting the right partners, and are they becoming productive fast enough?
Layer 4: Link-level optimization
→ Where conversion gains hide. Track referral links individually to identify top-performing links, optimize landing pages, and uncover underperforming assets.
Even strong partners can underperform if their links or landing pages are misaligned. Every referral link should be tracked individually so you can evaluate:
Clicks per link
Signups per link
Conversion rate per link
Link type performance
1. Identifying landing page issues
If a link generates high traffic but zero signups, the issue may be:
Messaging mismatch
Technical tracking errors
Poor page performance
Audience misalignment
Without link-level visibility, these problems remain hidden inside aggregate metrics.
2. Evaluating promotional strategy
Filtering links by partner helps you understand how affiliates promote your product. Are they using blog posts, email campaigns, or social media? Are custom domain links converting better than default ones?
These insights allow you to replicate what works across your program.
This layer answers: Which specific promotional assets actually drive conversions?
Layer 5: Click-level diagnostics
→ Trust, verification, and fraud prevention. Access detailed click-level data to troubleshoot issues, verify partner activity, and prevent fraud.
Sometimes you need more than summaries. When conversions drop unexpectedly or a partner questions tracking accuracy, detailed click logs become essential.
Click-level data should capture:
Referral link
Referrer source
Device type
Browser and operating system
Partner identity
Exact timestamp
This enables:
Diagnosis of device-specific conversion issues
Verification of affiliate activity
Investigation of suspicious traffic patterns
Resolution of attribution disputes
Without granular data, troubleshooting becomes guesswork. With it, you gain confidence in your reporting and credibility with partners.
This layer answers: Can we verify our data and resolve issues quickly?
How to apply this framework with Partnero
All five layers of affiliate analytics — program health, traffic and funnel performance, partner activation, link-level optimization, and click-level diagnostics — are built into Partnero’s platform.
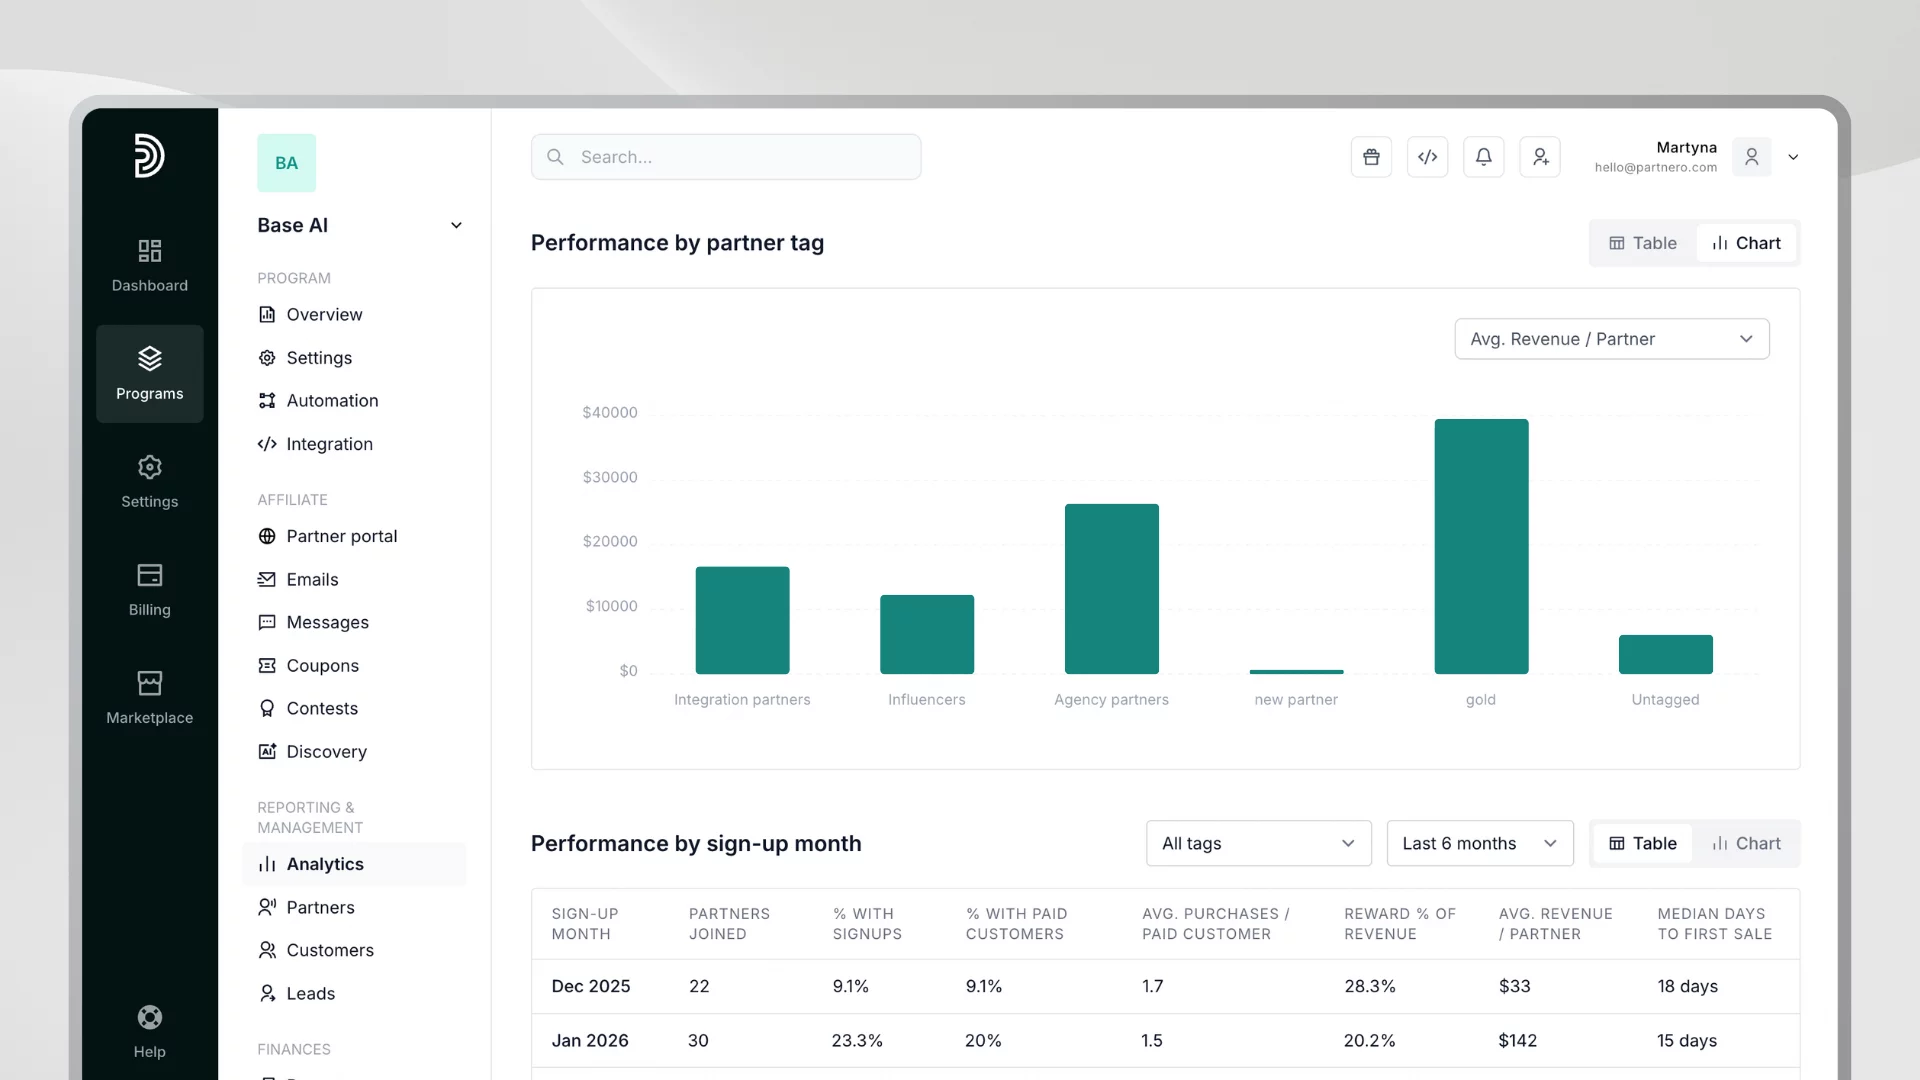
You can monitor overall program health with a single dashboard that shows partner activity, revenue, conversions, and payouts in real time. Performance reports allow you to analyze traffic, signups, and revenue trends with daily, weekly, or monthly granularity, while cohort analysis and partner segmentation make it easy to identify which affiliates are performing and why.
Link-level tracking and conversion metrics highlight which referral URLs are driving results and which need optimization. Click-level logs provide detailed data for troubleshooting, verifying activity, and preventing fraud.
By combining these capabilities, Partnero provides a single, integrated system that turns raw affiliate data into actionable insights, enabling sustainable growth and smarter decision-making.
Explore Partnero's analytics reports to better understand your performance and optimize your partner program:
Analytics Overview – High-level dashboard summary of your program’s performance
Performance Report – Detailed breakdown of conversions, revenue, and partner results
Partner Performance – Compare and evaluate individual partner results
Link Performance – Analyze how individual tracking links are performing
Click Activity – Review detailed click-level data and traffic insights
Lead Analytics – Monitor lead acquisition trends and quality
Affiliate analytics is a system, not a report
Measuring affiliate performance is not about exporting spreadsheets. It is about building a structured feedback loop.
Monitor program health.
Analyze traffic and funnel performance.
Evaluate partner activation and cohort quality.
Optimize links and landing pages.
Verify tracking with click-level diagnostics.
When these layers work together, affiliate program management shifts from reactive reporting to proactive growth. Programs do not plateau simply because traffic slows; they plateau when the insights needed to act on that traffic are missing.
The most successful programs measure beyond surface metrics, connect every stage of the funnel, evaluate partner quality, and maintain sustainable margins. When your analytics system integrates all five layers in a single view, affiliate growth becomes measurable, actionable, and sustainable.
This is the difference between merely running an affiliate program and truly scaling it.
Launch your program in minutes or get in touch for advanced setups.